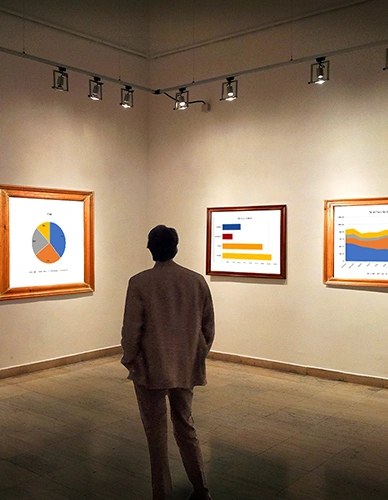
Making Your Charts a Work of Art

 Length
 1 hour
 Venue
Venue Online
 Cost
Cost FREE
Presenter
Christine Irons
Christine Irons
What is covered in this webinar?
- Understanding the key principles of data visualizations
- Data visualization best practices
- Understanding chart types
- Tips for making clean, clear charts
Why should I register?
A chart is a data visualization tool you can use in Excel to graphically tell a story. They allow your audience to see the meaning behind the numbers, and they make showing comparisons and trends much easier. Join us for this webinar if you want to add value to your charts by creating key insights clearly, quickly, and powerfully and become more comfortable with applying best practices to considerably improve the design of your Excel charts, as well as apply simple and creative technique to create more powerful data visualizations.


